Running Reports
Running reports in AIM can be done through a template that has been setup by an administrator or ad-hoc through the Portfolio Explorer tool in the system. To access the reporting options, click on the menu icon in the top left corner>Reports.
- Portfolio Explorer = ad hoc (can be saved and shared)
- Saved Reports = standard reports that are saved
- Shared Reports = saved reports that are shared with others in company
- Standard Reports = added in the system by admin or default these are out of the box standard.
- Tear sheets = relate to each of the properties.
Standard Reports
When running standard reports, you can filter for specific properties based on different criteria or choose a handful of properties to run. Reports can be run combined or separated for each property. Period, outputs, and currency can all be adjusted for the report being run. Simply click "Standard Reports" and select the report that you wish to refine to adjust the report.
Shared Reports
To share a report, navigate to Reports > Saved Reports > Select ‘All’ or the appropriate folder > Check off the box to the left of the report > Click on Actions > Select Share > Click on Add User or Add Role to give access to all users with a given role assigned. The user(s) selected will have the report showing in their Shared Reports tab next time they login.
Portfolio Explorer
Portfolio Explorer allows you to create new reports based on a variety of custom criteria.
You’ll need to select at least one criterion from each of the 3 sections on the left-hand side. The criteria are searchable and filterable. Simply drag and drop criteria to the query reporting canvas on the right and once all criteria are in place the report will populate.
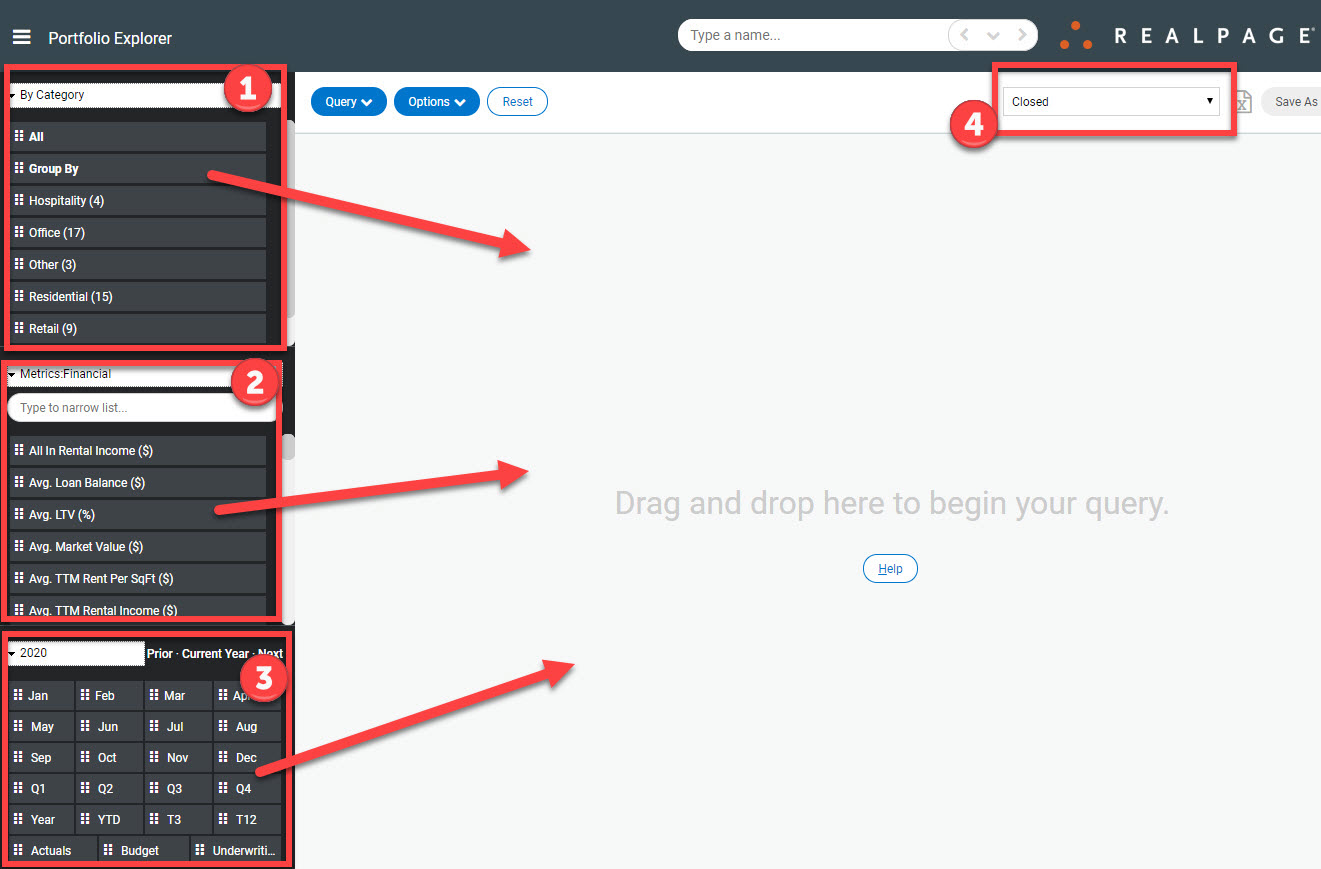
1. The first section controls the criteria for the property to report on. This can be a property, a fund, a location, etc.
2. The second section are the attributes or metrics that you want to run.
3. And the third box is the time frame for which you want the report to view. If you want to display a date range hold CTRL+Shift when dragging dates over and it will fill in all dates between the two selected. For example, if you drag January to the query, hold CTRL+Shift then drag December over, it will autofill all dates between the two.
4. Use this drop-down to filter on Closed, Sold, and other deal statuses.
Tip: If you want to use multiple criteria from each box hold CTRL when dragging and dropping otherwise the most recent criteria dragged over will replace what was there before. For example, you can drag actuals and budget from the box 3 to show both criteria along with a variance when holding CTRL. If you do not hold CTRL budget will replace actual.
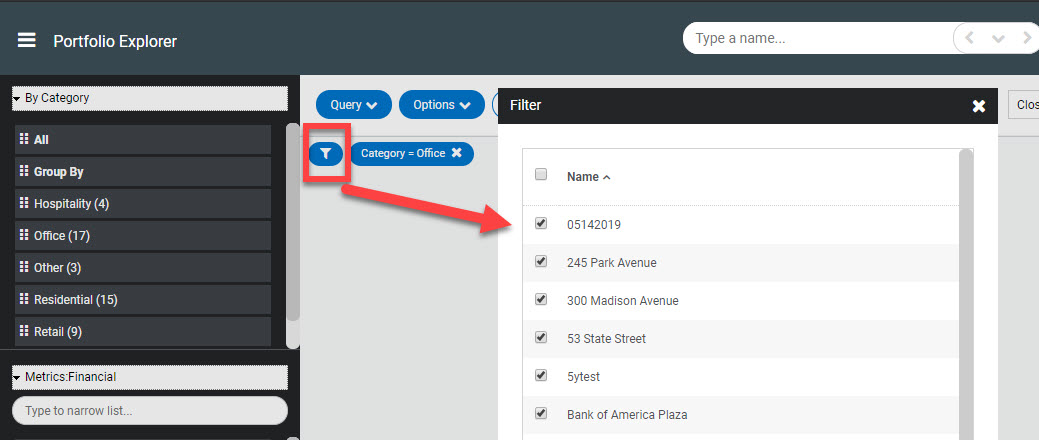
If you want to exclude specific properties from the report, you can click the filter icon in the top left of the query window.
To clear out all data click “reset”
Save by clicking the Query button > Save > Give the query a name. You can opt to ‘Store relative periods’ which will cause the report to pull data based on the selected time frame such as current month, quarter, year, etc. The saved Portfolio Explorer query will then appear in the list of Saved Reports.
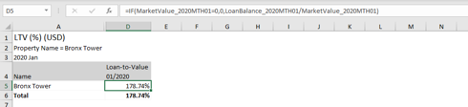
Exporting to Excel
All reports generated in the system can be exported to Excel by clicking the icon in the top right corner. When exporting data to Excel the underlying formulas used will be available in Excel along with the necessary fields used to calculate the data.